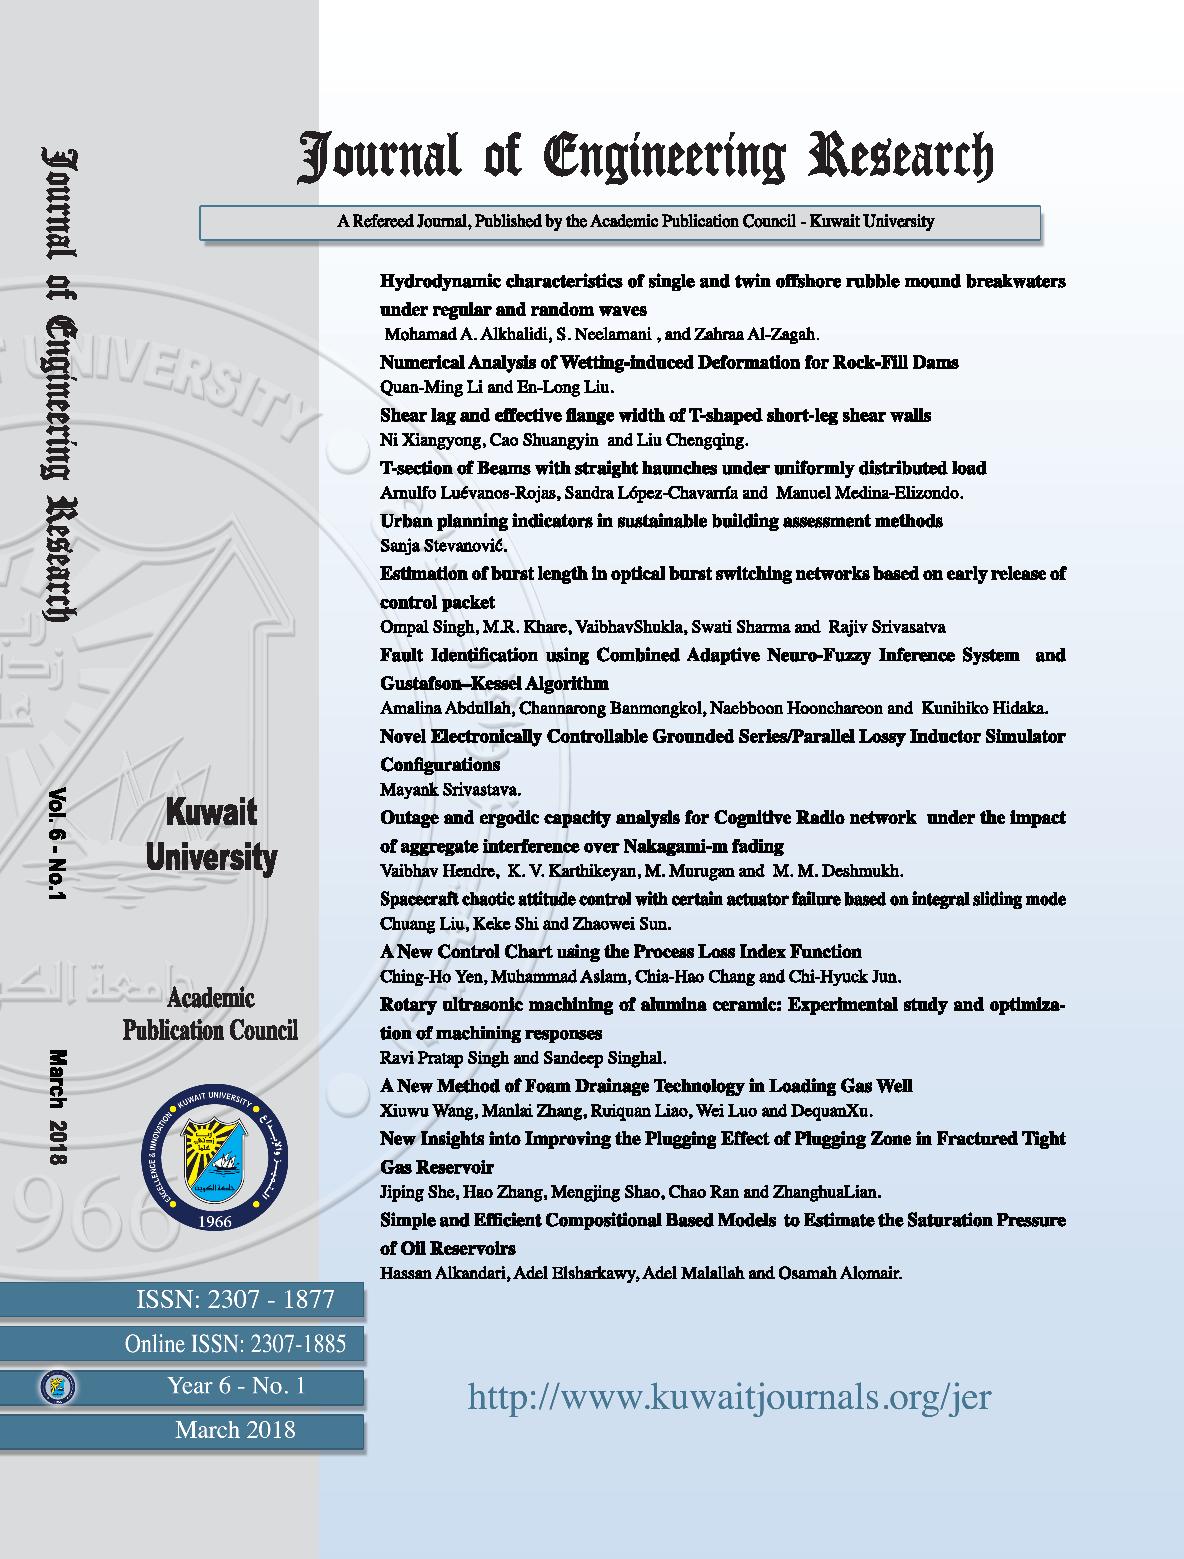
A new control chart using the process loss index function
Abstract
A control chart is a powerful tool used to monitor the variation of a process. In this paper, a new viewpoint of control chart based on process loss index is proposed. The control limits for chart are constructed. The operating characteristics function of chart is derived, which is used to describe how well the control chart can detect assignable causes. Also an average run length is computed to show how many samples are needed for the control chart to discover a change of process. In addition, comparisons are made with the existing control chart based on Cpm (Spiring, 1995) in terms of the operating characteristic curve and average run length. Finally, a real world example is given to illustrate the proposed methodology. Through the proposed method, practitioners can determine the corresponding sample size based on a desired value of the average run length to make the chart for monitoring the process capability.
References
Aslam, M., Yen, C. H., Chang, C. H., Jun, C. H., Ahmad, M. & Rasool, M. 2012. Two-stage variables
acceptance sampling plans using process loss functions. Communications in Statistics-Theory and
Methods, 41(20): 3633- 3647.
Chen, G., Cheng, S. W. & Xie, H. 2004. A new EWMA control chart for monitoring both location and
dispersion. Quality Technology & Quantitative Management, 1(2): 217- 231.
Chen, G. & Thaga, K. 2006. A new single variable control charts: An overview. Quality and Reliability
Engineering International, 22: 811- 820.
Costa, A. F. B. & Rahim, M. A. 2006. A single EWMA chart for monitoring process mean and process
variance. Quality Technology & Quantitative Management, 3(3): 295- 305.
Nezhad, M. S. F. & Niaki, S. T. A. 2010. A new monitoring design for uni-variate statistical quality control
charts. Information Sciences, 180(6): 1051- 1059.
Hawkins, D. M. & Deng, Q. 2009. Combined Charts for Mean and Variance Information. Journal of Quality
Technology, 41(4): 415 -425.
Huang, C. C. & Chen, F. L. 2010. Economic design of max charts. Communications in Statistics—Theory
and Methods, 39(16): 2961 -2976.
Johnson, T. 1992. The relationship of Cpm to squared error loss. Journal of quality technology, 24(4), 211- 215.
Khoo, M. B., Teh, S. Y. & Wu, Z. 2010a. Monitoring process mean and variability with one double EWMA
chart. Communications in Statistics—Theory and Methods, 39(20): 3678 -3694.
Khoo, M. B. C., Wu, Z., Chen, C. H. & Yeong, K. W. 2010b. Using one EWMA chart to jointly monitor the
process mean and variance. Computational Statistics, 25(2): 299 -316.
Li, Z., Zhang, J. & Wang, Z. 2010. Self-starting control chart for simultaneously monitoring process mean
and variance. International Journal of Production Research, 48(15): 4537 -4553.
OstadsharifMemar, A. & Niaki, S. T. A. 2011. The Max EWMAMS control chart for joint monitoring
of process mean and variance with individual observations. Quality and Reliability Engineering
International, 27(4): 499 -514.
Ou, Y., Wu, Z. & Goh, T. N. 2011. A new SPRT chart for monitoring process mean and variance. International
Journal of Production Economics, 132(2): 303 -314.
Serel, D. A. 2009. Economic design of EWMA control charts based on loss function. Mathematical and
Computer Modelling, 49(3): 745 -759.
Spiring, F. A. 1995. Process capability: a total quality management tool. Total Quality Management, 6(1):
-34.
Spiring, F. H. & Yeung, A. S. 1998. A general class of loss functions with individual applications. Journal of
Quality Technology, 30(2): 152 -162.
Teh, S. Y., Khoo, M. B. & Wu, Z. 2012. Monitoring process mean and variance with a single generally
weighted moving average chart. Communications in Statistics-Theory and Methods, 41(12): 2221 -2241.
Teh, S. Y., Khoo, M. B. & Wu, Z. 2011. A sum of squares double exponentially weighted moving average
chart. Computers & Industrial Engineering, 61(4): 1173 -1188.
Wu, Z. & Tian, Y. 2006. Weighted-loss-function control charts. The International Journal of Advanced
Manufacturing Technology, 31(1- 2): 107- 115.
Wu, Z., Wang, P. & Wang, Q. 2009. A loss function-based adaptive control chart for monitoring the process
mean and variance. The International Journal of Advanced Manufacturing Technology, 40(9- 10): 948- 959.
Wu, Z., Tian, Y. & Zhang, S. 2005. Adjusted-loss-function charts with variable sample sizes and sampling
intervals. Journal of Applied Statistics, 32(3): 221 -242.
Wu, Z. & Tian, Y. 2005. Weighted-loss-function CUSUM chart for monitoring mean and variance of a
production process. International Journal of Production Research, 43(14): 3027 -3044.
Yang, S. F. 2013. Using a new VSI EWMA average loss control chart to monitor changes in the
difference between the process mean and target and/or the process variability. Applied Mathematical
Modelling, 37(16): 7973- 7982.
Zhang, J., Zou, C. & Wang, Z. 2010. A control chart based on likelihood ratio test for monitoring process
mean and variability. Quality and Reliability Engineering International, 26(1): 63- 73.
Zhang, J., Zou, C. & Wang, Z. 2011. An adaptive Shiryaev-Roberts procedure for monitoring
dispersion. Computers & Industrial Engineering, 61(4): 1166- 1172.
Zhang, S. & Wu, Z. 2006.Monitoring the process mean and variance using a weighted loss function CUSUM
scheme with variable sampling intervals. IIE transactions, 38(4): 377 -387.
Zhou, Q., Luo, Y. & Wang, Z. 2010. A control chart based on likelihood ratio test for detecting patterned
mean and variance shifts. Computational Statistics & Data Analysis, 54(6): 1634- 1645.


